The table below lists Census blocks in Minneapolis in a descending order of percentage of white, as recorded in the 2010 Census. Which of the above three questions can be answered with this table?
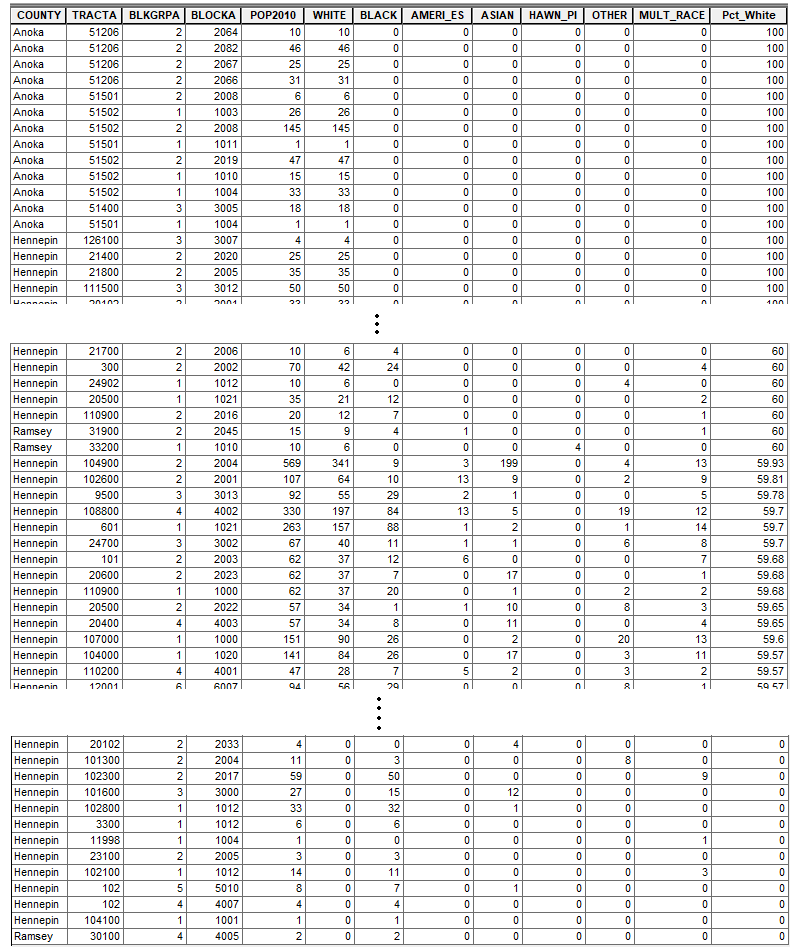
2010 Census Summary File 1 Table P3
The map below is a different presentation/visualization of the same data. Which of the three questions can be addressed with the map?
% of White, computed from 2010 Census Summary File 1 Table P3
To help you see the significance location plays in addressing geospatial questions, the second map is created from the same percentage values, but the locations of the percentage values are changed by randomly pairing the percentage values with the Census blocks. Which of the three questions would get a different answer with this new map?
% of White, 2010, with locations of the percentage values randomly shuffled using the GeoDa software.